The newly hired Chief Audit Executive (CAE) was presented with a challenge. During her first month, the CFO had shared an article on use of analytics by internal audit and wanted to see her plans for becoming more data-driven. As she had learned during her interviews for the job, the prior CAE had invested in data analytics software and training but had very little to show for it.
Despite that investment, the use of data analytics by the audit team was still in its infancy. Many of the internal audit team were new to the company. Team members were split between using the audit software purchased by the prior CAE, Microsoft Excel, or perhaps Tableau, which had recently been purchased by the IT organization as part of a customer analytics initiative. The prospect of using Tableau was appealing, but she was concerned that learning a new tool might have similar results as the old one.
She had heard good things about Visual Risk IQ from an IIA chapter colleague, and after some thoughtful Q&A regarding how we had helped others, we were hired to help her advance their data analytics initiative through a mix of on-the-job training and some planning exercises.
One of her goals was to develop a strategic plan for the use of data analytics that she could share with the CFO and her audit committee. She believed in the maxim that a goal without a plan was just a wish, and she wanted to chart a course and describe how her team would advance on that journey. Using Visual Risk IQ’s maturity model template, we helped her define what success would look like. For the first year, she set three main objectives:
1) Develop internal procedures for running the data analytics effort. This included tracking and managing workload, reviewing procedures, and reporting and managing the data itself. 2) Identify two continuous monitoring opportunities and implement those solutions by year-end. 3) Make data analytics part of every audit project. Incorporate data analysis into planning, fieldwork, and reporting.
For objective one, her team developed internal policies and procedures themselves.
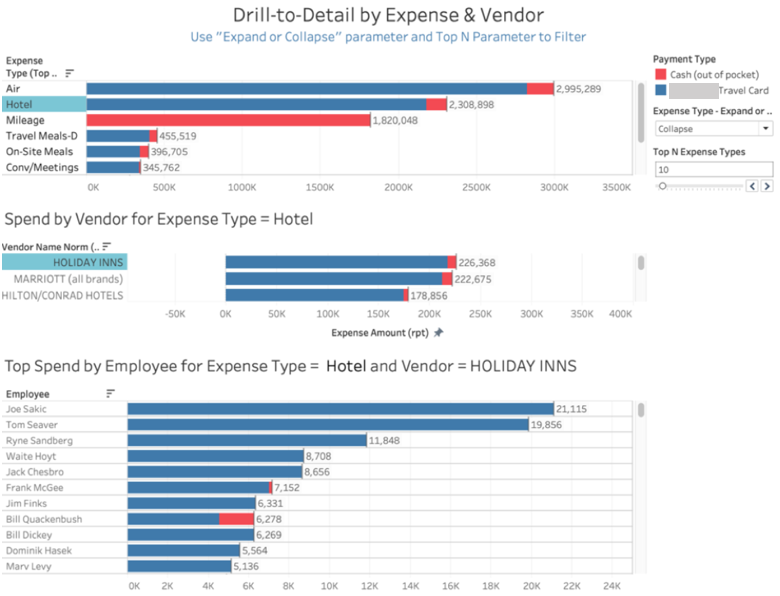
For objective two, after some time evaluating the skills of the analytics champion they’d hired, we helped the team identify two opportunities for continuous monitoring. We recommended projects that would help that person develop their skills while also contributing toward the audit plan. Because of the ease of accessing data and the relatively high error rate, travel expenses were first on the list. We assisted the champion on how to define a project using a design blueprint that connected business questions to source data. We provided coaching on which tests would likely yield the greatest value, and then showed how visual reporting with Tableau would display results clearly and shorten the time it would take for follow-up. Their analytics champion was able to handle most of work effort, but when he got stuck, Visual Risk IQ was there to help. Next up was AP Discount Analysis – more on that next week with our next Blog post.
For the third objective, Visual Risk IQ has helped their data analytics (DA) champion get involved in the planning for each audit project. Following the example from the T&E audit, they hold a brainstorming meeting for each audit to identify opportunities for data analytics and visual reporting. Some ideas have been implemented and while others are tabled, but that consistent conversation has started to change the way the entire audit team thinks about data throughout the audit.
Fast forward to the end of the year. With a little help from Visual Risk IQ, the audit team has been able to meet their objectives and their champion has become more efficient and effective at using data analytics throughout the audit process. Two other team members have enrolled in data analytics certificate programs. Data is contagious!
The team is becoming increasingly competent and independent, and we see that as the true success story. Unlike many firms whose sole goal is to deliver analytics, Visual Risk IQ aims to raise data skills across the internal audit profession.
Let us know if you’d like a free copy of our maturity model template or if you’re interested in accelerating your climb up the data analytics maturity curve. reach out to us @ Joe.Oringel@visualriskiq.com or David.Poisson@visualriskiq.com.